Infographic designs are one of the most popular and fun ways to present information or product. It may be easier than you to imagine designing infographics that are increasing in popularity in media and digital marketing. In this article, five online programs can create attractive infographics in a few minutes.
Infographics are the favorite visual communication tool of recent times. There are many online and desktop tools that you can make infographic designs. The success of your infographics will undoubtedly depend on your creativity. However, we must admit that we all live in lives in which we race against time. Therefore, our key question is, "How to design an infographic as soon as possible?" it will be. Of course, you can design infographics with the design programs you have used for years. Still, with these infographic design programs, it is possible to prepare interactive infographics in a short time. We have listed five tools to create an infographic in this article.
DesignCap
Infographic Maker
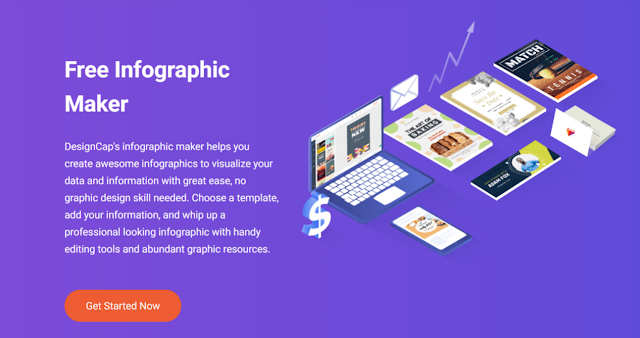
You probably already know this tool. DesignCap Infographic Maker is a potent and easy-to-use online design tool suitable for all kinds of projects, from a brochure to an infographic. DesignCap provides you with an extensive library of images, icons, graphics, fonts, templates, and features.
What is worth of being mentioned is its chart feature. It allows you to add data automatically from a CSV, XLSX, XLS file, and edit the format of the text and chart style manually at will. You can search for a country or region map and insert it into your design as well, very friendly. With DesignCap, you can create other documents, marketing materials, and social media graphics.
Snappa
Infogram
Infogram is a free online tool that will allow you to create infographics, maps, diagrams, charts, etc., all with just a few clicks. Infogram is another solution for creating visual aids to support your data. Once registered, the application will offer you three creation possibilities: infographic, graph, and map. You will then have the option to upload photos and videos and enter and modify the data that constitutes your infographic in an Excel-type tool. The software will automatically change the appearance of the infographic also correctly to represent your data. When you are satisfied with your infographic, you can publish it on the Infogram website for everyone.
Piktochart
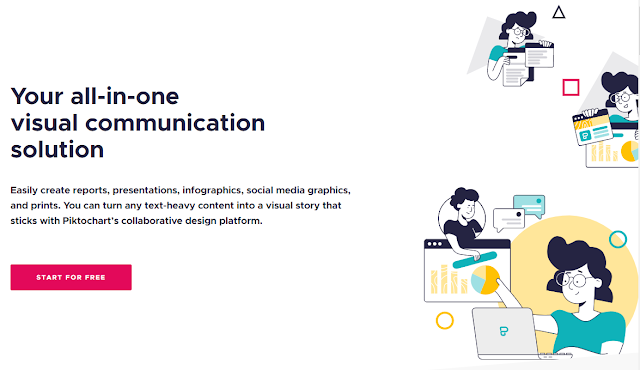
Piktochart is an online tool that allows the creation of infographics thanks to a wide range of templates. This tool is a kind of customizable and modifiable canvas according to the tastes of each one. Picktochart will let you turn boring data into engaging infographics with just a few clicks. Its grid models also make it easy to align graphics and proportionally resize images.
Illustrator and Photoshop
You probably already know Illustrator and Photoshop, the Adobe suite's two very powerful tools, the market leader in visual creation. These two tools, coupled with the Adobe library, will give you great artistic freedom. However, we do not recommend them if you have not mastered them well or if you do not have a lot of time.
Conclusion
It is a
meaningful combination of infographics, information, and graphic design. It
enables long texts and complex data to be presented in a striking way, easily
understood and memorized. But if you don’t have any idea about how to create an
infographic, check those tools, and you will love them.


.png)
.jpg)


No comments:
Post a Comment